
Price Action - Part 3
- speersd1
- Jan 17, 2024
- 5 min read
This is part 3 of a series on recognizing price action patterns in Chart Logic. For parts 1 and 2, see here.
In this post we are going to add the bearish price action and bull signal to our strategy, and look for any adjustments that need to be made when they are both working at the same time.
As we continue to talk about these things, I am delighted to see how CL is living up to its objective of being able to talk meaningfully about these models in plain terms, once we get past a little bit of jargon from CL like "condition" and "logic set." We're talking about a candle close above a high (Close[1] > SH), and it's absolutely clear what we mean. Which means we can develop our models, either simple logic or more complex trading strategies, by talking about what's meaningful on the chart, rather than trying to code it all in some programming language. It takes planning and practice of course, and hopefully that's what I'm demonstrating in these tutorials.
Starting Point
Here’s where we are after Part 2. We have a bullish pattern SH-SL-HH, including what to do when followed by a swing after the pattern:
HH - Move Bull HH up to the new Swing High
LH - This invalidates the pattern; we’re not bullish. Bull LH becomes the Bull SH, and we clear the rest of the pattern and signal.
HL - Bull HH becomes the new Bull SH; Bull HL becomes the new SL, and the Bear Signal line moves up to the new Bear SL. We no longer have a Bull HH.
LL - This is the bear signal which will trigger some action when we put this to use.
If that's a little hard to follow, check out the previous post where walk through it one step and a time and show what's going on with graphics.
I’m tracking the current pattern with chart objects so I can see it unfold, but they go away when the pattern is invalidated. A Bear Signal line is drawn when we’ve formed a Bull HH; this is the trigger that activates the Bear Signal price/line. And then if we close below the Bear Signal line that generates the signal. I’m also drawing a rectangle on the screen when we generate a bear signal, to record where this is happening for future reference. An instance of this logic looks like this:

Watching these patterns form I notice they are pretty brittle and short-lived. We get some kind of swing high or swing low very frequently, and the pattern adjusts in real time based on the logic we have coded. I'll need to consider whether the signals are giving useful feedback, or if they're triggering too frequently to be meaningful.
Bearish Price Action
Now I’ll duplicate all this logic for the reverse case. I don’t need to start from scratch, I can clone the Bull patterns and edit the individual conditions to adjust them for the bearish pattern. It’s still a bit of work, but it’s far easier than writing the whole thing from the beginning.

The two sets of patterns have no trouble performing at the same time on a chart (though some of the labels overlap each other):

The problem is that this simple model is generating way too many signals, and they don’t seem to be particularly predictive of subsequent movements.

That is some weird modern art!
It can be difficult to know when looking at a result like this what action to take to get closer to the result you want. You know what you want it to do, but it's not always obvious how to get there. This is just trial and error, experience and intuition, iteration and improvement. The approach to signals I'm describing here has its origin in the signals written for MultiMAX, so I have some prior experience and existing (procedural) code for how I want signals to work. Working with Chart Logic you can save a copy of your strategy file, make some changes and then see if you're happy with the result. If not, it's easy to go back to the previous version you saved and start again.
I’d like to say, once I get a bearish rectangle (after a bear signal), we don’t form a new bullish signal line until it is completely below the bearish rectangle; and once we get a bullish rectangle (bull signal), don’t form a new bearish signal line until it is completely above the bullish rectangle. That should give us some more separation between the signals. First we need to start tracking the last bull/bear signal line, at the moment the rectangles are forming:


What we want to get is some separation between our signals. When forming a new Bull SH (the start of a new bullish pattern), if there’s a Last Bull Signal then we want to be sure we’re sufficiently far above it. We can do this by testing that the lows of the 3-candle swing high pattern are all higher than the Last Bull Signal price.

And repeat for the New Bear SL candle, when we’re forming a new bearish pattern.
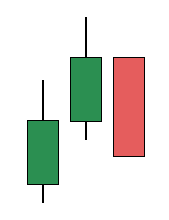
Why this test specifically? Let’s sketch it out. This is the moment we’re performing our test:

This is a new Bull SH, starting a new bullish SH-SL-HH pattern following a Bull Signal. I want to follow a Bull Signal because the bullish pattern is needed to create the next bearish signal line, which we want to look for above the bullish signal. To make sure that the next bullish pattern is sufficiently far above the previous Bull Signal, we test the Low[3,2,1] of the candles in the Swing High pattern, to make sure they are all higher than the Bull Signal. This gives us our separation. We repeat the same thing for the Bear Signal. We’re testing the Highs[3,2,1] of the candles in the Swing Low pattern, to ensure they are all below the Bear Signal:

Let’s see how this affects the formation of our bull and bear signals now:

Much better! Obviously I’ve chosen a chart that shows this working well, and there are also examples of where there could still be improvements. But I think for the purposes of this tutorial we’ve accomplished our objectives, and there’s plenty of opportunity to play with these structures and improve from this starting point. I'll leave further improvements as an exercise to the readers.
This is the end of Part 3. In Part 4 we complete the reification of the bull and bear signals. Basically, we clean things up so we can easily use the signals as part of trading strategies. I’ll show the finished product of the work up until now, and show an example of the signals put to use in a trading strategy in Chart Logic.

Comments