
Price Action - Part 1
- speersd1
- Jan 13, 2024
- 6 min read
This blog post is the first in a short series on how use Chart Logic to detect and do something (hopefully) useful with price action patterns. It's a kind of tutorial, but also aimed at clarifying my own thinking and approach to this type of logic.
Introduction
In CoralMAX and MultiMAX there is a signal that is used to identify when price may be changing direction. It is similar in concept: recognize price action patterns, identify moments when those patterns are "broken," and then trigger the signal. The patterns in Max are very complex, far more than what we're going to cover in this CL tutorial. But my hope is that what we'll end up with is a price action signal that can be dropped into our Chart Logic strategies when we're looking for entry conditions in our strategies.
This is also a precursor to more complex structures that we're going to be talking about in Chart Logic, such as ICT concepts. There's a lot to cover there and I am by no means an authority on ICT. My hope is that by developing these approaches to using Chart Logic in a public forum like this that it can become a collaborative effort, making the overall result better and more useful for everyone.
I will also post the Chart Logic files as they look at the end of each part, so you can download, examine and run them on your own charts. If you have any questions about why I did something a certain way, don't hesitate to ask. And if you have a better way to accomplish something similar, by all means let me know! There are so many different ways to approach similar problems, mine may not be the best way.
Chart Logic is a kind of declarative rules engine. This is a completely different approach to programming logic from what you'd do when writing code in a language like C++, Java or even MQL4. These languages are procedural. Do A then B then C. Chart Logic is declarative, in that valid bits of "code" are executed when certain states evaluate as true. There are many programming languages and systems that work this way, things like Prolog or Drools. If you're familiar with this approach then it can be helpful to have this orientation in mind when building Chart Logic strategies. If you're new to it then it can take a little getting used to. CL allows us to talk about information about charts and candles in very simple terms, but also to build them up into more complex structures. Once you get used to the user interface and the types of objects we have and how they work together, I think you'll find that CL makes it incredibly easy to talk about, and program logic around, things that would be much more involved to write in a programming language like MQL4.
Okay, let's get started.
Price Action
Price Action refers to the movement of price on our charts, and the patterns that are formed in the candlesticks as a result. We use price action to try to divine what is happening, and in our more daring moments, to try to predict where price is likely to go next.
These posts will be about how to work with price action in Chart Logic. It is a concept that starts off from very simple beginnings, and quickly becomes surprisingly complex. Showing how I deal with these concepts in Chart Logic can be useful for anyone looking to do something similar. Hopefully by the end I’ll have described an approach for using price action as a signal that we can use as part of more complex Chart Logic strategies, in circumstances when we break the price action patterns.
Counting Candles
When we’re looking at candles on a chart, and in Chart Logic, we number the candles starting with the current candle at zero, and increasing the numbers as we go to the left. This number is the shift.
We also talk about different data from the candles, like the high and low. I’ll be referring to these using the shift, like this: High[0], Low[3]. You know which data I’m referring to, and for which candle.
Swing High / Swing Low
Let’s start with simple terms. A “swing high” is a three-candle pattern where the middle candle high is higher than the previous and next candle highs, in other words: High[3] < High[2] > High[1]. For example:
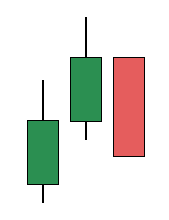
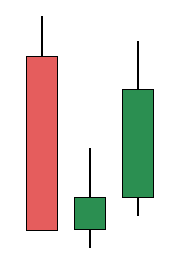
A Swing Low is the opposite: Low[3] > Low[2] < Low[1]:
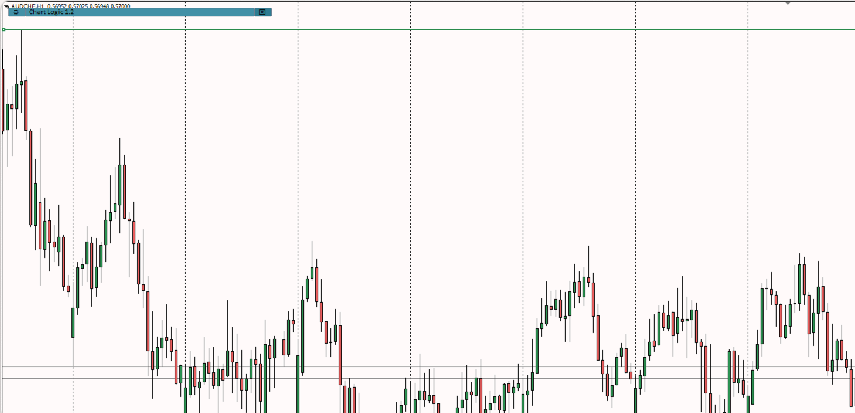
With these simple definitions we can start to identify places on the chart where price is doing something interesting. For instance, with this chart:
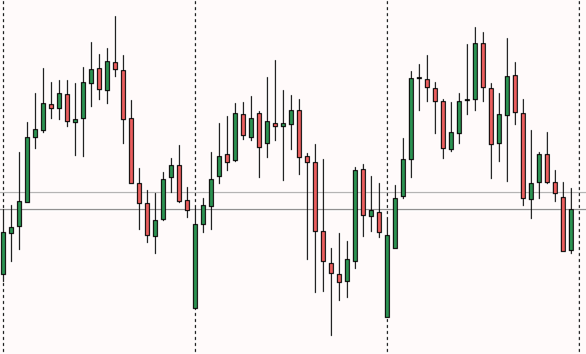
The problem is, we humans are GREAT at identifying the relevant data that we want to focus on, but computers are precise, sometimes frustratingly so. For instance, if I wanted to identify the important swings high and low on this chart, I might come up with something like this:
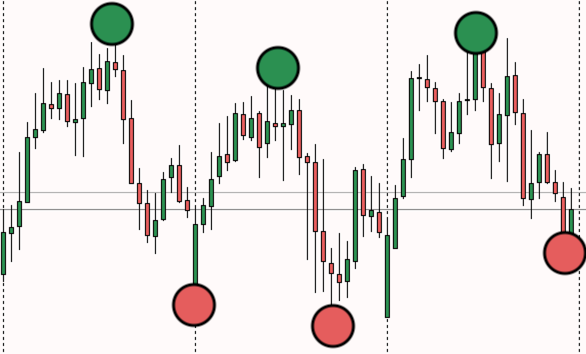
I wrote a little script in Chart Logic to identify the swings high and low and draw an arrow above / below the relevant candles, and this is what it’s telling me:
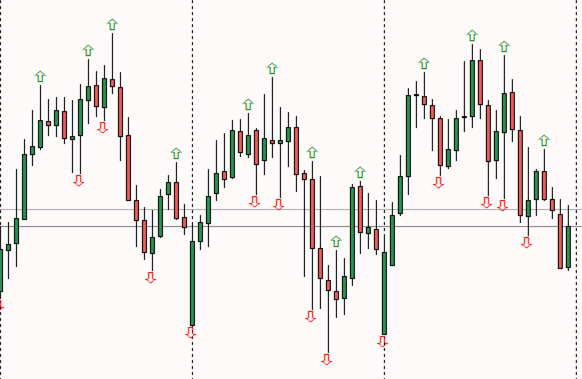
Obviously we are going to have to be a little smarter about talking about price action. The goal is to get closer to something like the previous image, where we are focusing on the more important areas on the chart, and not simply recording every swing high and swing low.
I’m going to be focusing on the bullish price action initially. Once I have something that is working well then I’ll duplicate it for the bearish patterns.
Bullish Price Action
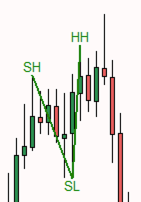
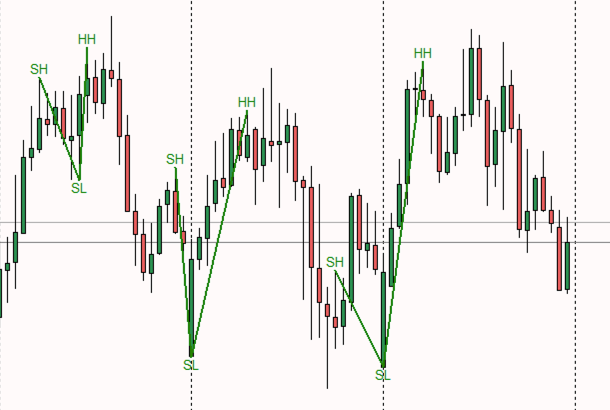
I am looking for a three-swing pattern: Swing High, Swing Low, Higher High. When we see this pattern, this establishes the beginning of bullish price movement.

I am going to define this in Chart Logic using similar terms:
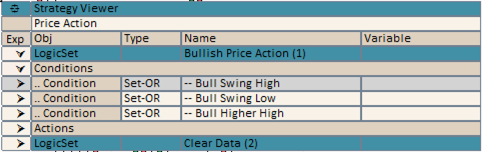
When all three of these conditions are true, that means I have the three-swing pattern. In that case I will draw some objects on the chart to show me the pattern. I’ll put a label above and below the swings, and connect them with lines:
I’m not too worried at this point about making it pretty, this is just to make it clear to me while developing the strategy what it’s doing, and if there are any changes I need to make.
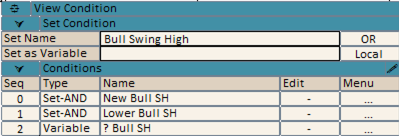
For the swings, these are set conditions. The condition should return true if I detect a new swing or if the swing already exists.
Let’s look at each in turn.
The New Bull SH is pretty straightforward:
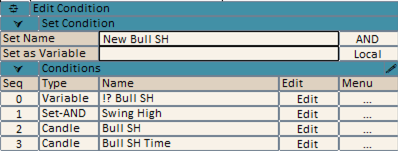
0 - !? Bull SH - This means that this condition will only evaluate as true when we do not already have a variable called “Bull SH” set. If it’s set we already have a Bull swing high, and therefore this can’t be a new Bull SH.
1 - Swing High - This is the three-candle pattern for a Swing High that we defined above: High[3] < High[2] > High[1].
The last two Candle conditions are setting the variables “Bull SH” and “Bull SH Time”, using a shift of two:
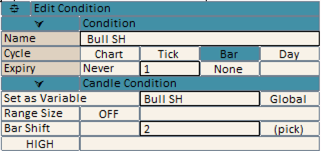
This is the middle candle in the three-candle pattern. These are being set as global variables that do not expire, so I can reference them outside of this logic set.
When I ran this the first time it became immediately obvious that I needed to handle the case when I already have a Bull SH and a Bull SL, but then I never go above the Bull SH again.
It identified a Swing High (way up there in the upper left corner of the chart), and then the pattern never completed because it never found a Higher High. Clearly I need to handle the case where I already have a Swing High, but I get a lower Swing High. This invalidates the bullish pattern: Bull SH - Bull SL - Bull LH. Thank you for playing, please try again.
The “Lower Bull SH” condition detects when we have a Bull LH, and clears the variables (invalidates the pattern):
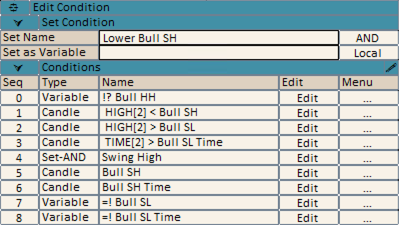
I won’t go over every condition here, hopefully by now this is pretty clear. We do not yet have a Bull HH, but we do have a Bull SH and a Bull SL. I don’t explicitly test that the variables “Bull SH” and “Bull SL” exist, because the Candle conditions that are testing for Bull SH > High[2] > Bull SL would fail if these variables are not set, so the existence of the variables is already covered. I also added some tests to make sure that the swings happen in the correct order by testing the candle times, otherwise you get some strange looking patterns where the Bull SL happens first, then the Bull SH, which is not what we want.
Here’s how this performs:
That’s not too bad! We look for the 3-candle pattern, and when it occurs we draw it out, clear the variables and start looking from the beginning again. Compare that to the chart from the beginning when we were eyeballing where we thought the swings should be recognized:
Usually when looking at price action patterns we look at longer, more complex patterns than this. SH-SL-HH-HL-HH. We could continue to extend the Chart Logic conditions in this way. But my immediate objective is a little simpler: I want to detect when we have a valid bullish pattern (SH-SL-HH) and then we get a break of that pattern, indicating a potential bearish movement. That is, when we get a SH-SL-HH pattern and then we get a Close[1] below the SL. That is the topic for the next post.
Impressive work sir