
Chart Logic Sneak Peek / First Looks
- speersd1
- Nov 23, 2023
- 7 min read
Updated: Nov 24, 2023
I announced Chart Logic, my new EA, in last week's update. So much progress has been made since then, so I'd like to start to share more details about what this EA is, what it does and what you can do with it.
Ready to think Logically?
Here's a pretty picture to pique your interest. The UI and features will likely change; I've been more focused on the core, under-the-hood type stuff, this UI is just the minimum I needed to see what's going on during development. But it will give you an idea.

Building Blocks
The essence of Chart Logic is to define a set of conditions and actions. Conditions are things that have to be true, and actions are things that happen when all the conditions are true.
Conditions
The conditions are things you want to test. For all conditions you specify how frequently you test it, called the "Cycle", and how long it will considered to still be true after it passes, its "Expiry".

With the Cycle you set the Timeframe, and whether the update cycle is based on a Tick, a Bar or each Day.
For the Expiry the choices are a number of seconds, bars, ticks, or never expires. When you're configuring the Expiry, a summary of the time will be shown as well (where it's telling you, helpfully, that 20 H1 bars represents 20 hours).
Every condition also has a name, which is automatically set based on the settings for the individual conditions.
From this starting point, there are 8 different types of conditions currently available:

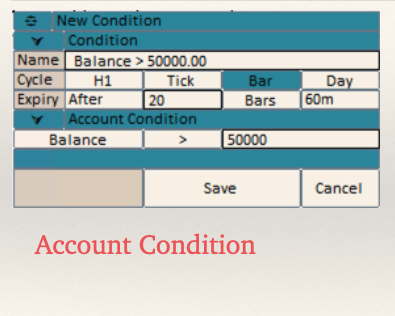


Account Condition - Account balance, equity, drawdown %, drawdown $, Free Margin, Margin Level %
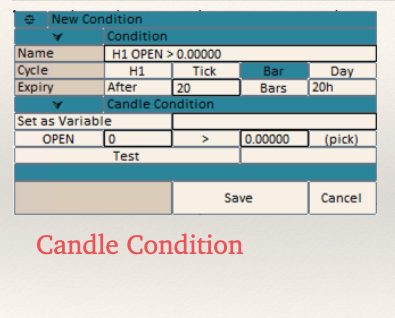
Candle Condition - Open/Close/High/Low/Volume/Time values from candles
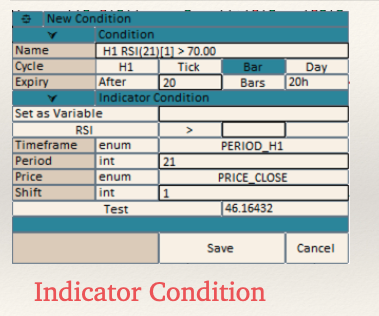
Indicator Condition - Select and configure an indicator and the value to test
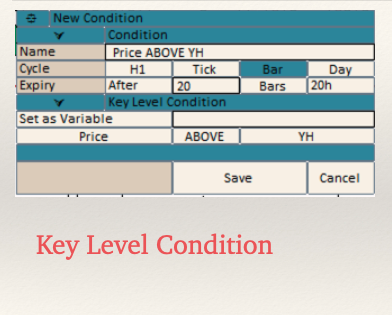
Key Level Condition - Yesterday, Today, Last Week, Last Month High/Low values
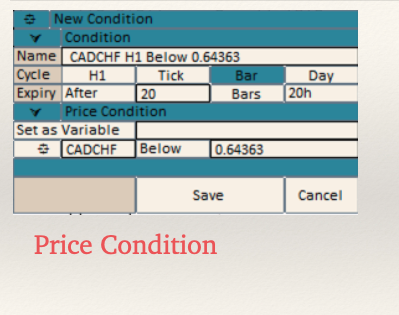
Price Condition - Price is above/below a specified price on a specific chart
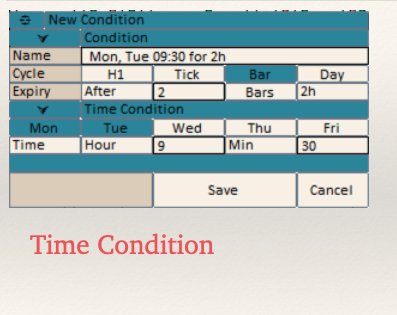
Time Condition - Day of week and time of day conditions
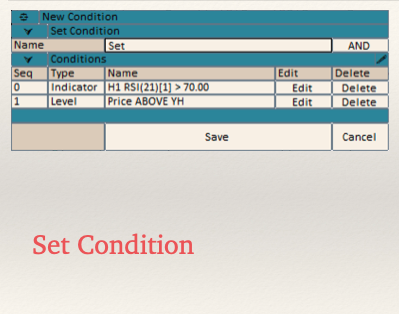
Set Condition - Groups of conditions joined by AND or OR conjunctions
Trade Condition (not shown) - Observations about open trades or positions (amount of profit/loss, risk, distance, etc.)
The Indicator Condition has built-in support for the most common technical indicators provided by MT4. Just select the indicator from the list and the parameters to configure will be populated in the list. But there will also be a "custom" indicator type, which you can use to configure any indicator you have installed in your environment, as long as you know the parameters that you need to pass to it. As long as the indicator exposes the data that you want to access, you can use it from within Chart Logic.
Some conditions let you save their values as variables, which you can then reference in other conditions and actions. For instance, you can use an Indicator Condition to test when RSI exceeds some value, and then use the Candle Condition to set that candle's Close price to a variable called "BEAR SIGNAL." You can then use another Candle Condition to detect when price closes below the stored variable, as a kind of entry condition.
The point is, you are at complete liberty to combine this logic in any way you'd like. When a Condition is storing its value in a variable it always tests true; otherwise you define the test for a Condition, either referencing specific values (like saying "RSI > 70") or by referencing variables (the close price of the signal candle I detected earlier).
Actions
When all conditions in the set have tested true, then all of the actions in the set are activated. Actions are things you want to do.

Action properties are much simpler: they have a name, which is automatically set based on your selections; and a Delay, measured in seconds.
When an Action fires you can set a Delay timer, which controls how much time must pass before this Action can be triggered again. This can be useful for things like alerts where you don't want to keep getting notified of the same thing over and over.
There are currently 4 action types, but I only have images ready for 2 of them:

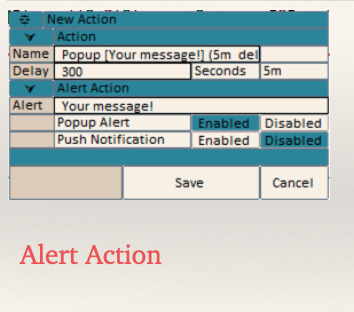

Alert Action - A popup alert or push notification (or both) with a specific message. There are also variable substitutions available that you can put in your alert text, like account balance, drawdown, number of open trades and so on; or any defined variable from other conditions.
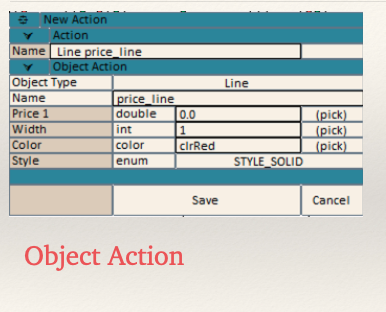
Object Action - Create a chart object. Select from various arrow types, lines, text, and so on, and their properties are displayed for you to configure. For any of the parameters that are not select lists you can specify a variable to use rather than a specific value. This is useful, for example, if you set a variable for a price on a chart based on some conditions, then you want to show a line and/or text on the chart at that price.
Disable Action - When this action is triggered then the entire set (the collection of Conditions and Actions) is disabled, and no further operations will take place. This is useful for one-time events that you don't want repeated. There is no configuration window for a Disable condition.
Trade Action (not ready yet!) - Open/close/partial closes of trades, close entire positions, move a SL or TP and so on. Use Conditions to identify trades, and Actions to execute operations on trades.
Logic Sets
Conditions and Actions are the basic building blocks. You combine them all together into a single grouping called a Logic Set:

The Conditions in a single Logic Set are tested in order; all Conditions must pass for the Actions to be triggered. Once all of the Conditions pass then all of the Actions are run.
Strategies
You then group all of the Logic Sets together into a single object called a Strategy.

With a Strategy, you specify the Symbols that it can run on (either all symbols in Market Watch when the Strategy is run; the Major pairs; a list of symbols of your choosing; or just the current chart). You can also give the Strategy a magic number, in which case all of the trade operations performed in this Strategy will be limited to that magic number. Multiple strategies can run side-by-side without interfering with each other this way.
Threads
When you run a Strategy, it will create a separate instance of the Strategy for each symbol that it is running on. These instances are called Threads. All of the variables that depend on what's going on with specific charts are limited to a single Thread. That makes sense, because things like Indicator values, key levels, prices and so on are specific to a symbol. It wouldn't make sense to measure Yesterday's High on one symbol and try to draw a line for it on another symbol.
You can save Strategy files to disk and re-open them later. You can even develop your own strategies and share them with other Chart Logic users.
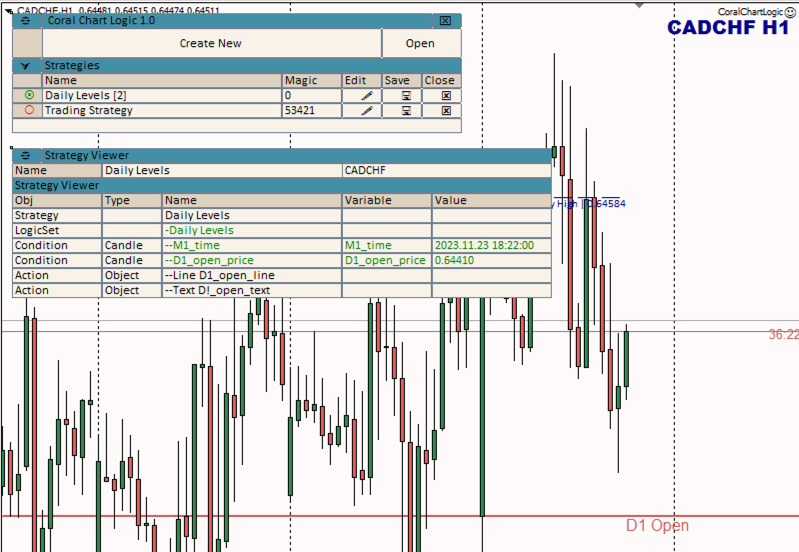
The Strategy Viewer
It can be a little tedious to click through all those dialogs to get a high-level view of what's in your Strategy. The Strategy Viewer shows you the hierarchical structure of your Strategy in a single, expanded view:

I'll probably have to add some kind of expand/collapse feature to this, because Strategies can get arbitrarily large. But for these simple examples this has been plenty.
When you activate a strategy, it creates as many Threads as it needs depending on its settings, and then you can view the state of each Thread in the Strategy Viewer. This will show you the values of any variables that have been set in the Thread, and any Conditions that are currently testing true. If all Conditions in a Logic Set are true, then that Logic Set heading is also highlighted in green:

This gives a high-level view of what's going on with your Strategy, for the selected Thread. You can choose any of the running Threads from the drop-down menu in the upper-right corner (the currently selected Thread is CADCHF).
If you're on the chart where a Thread is running, then that Thread will draw any of its chart objects, based on any Object Actions that have fired:
Each Thread maintains its own copies of all objects even if it's for a different chart from where Chart Logic is running. You can safely change charts while Chart Logic is running and it will seamlessly continue to track all of its state. When it initializes on a chart where it has a running Thread it will create all of the chart objects that have been triggered, even if it was on a different chart at the time the objects were created. Everything is tracked internally by Chart Logic.
Because you're specifying the timeframe as part of your Conditions, it doesn't matter what timeframe the chart is on where Chart Logic is running. It will process data on every tick and each Condition will keep track for itself whether it's the right time for it to do something or not based on its own data.
Strategy Tester
Once you have defined a Strategy in Chart Logic, you can run it in the MT4 Strategy Tester.

You specify the Strategy file to test in the inputs, and it will load this file to run in the tester. The main window is not displayed in this case; it brings up the Strategy Viewer to display the running Thread. There is only one Thread in this case, for the current chart configured in the Strategy Tester settings.
So, you can define a trading strategy. Load it in the Strategy Tester and run it, and then come back and tweak your settings based on your results. Chart Logic is a full-blown MT4 strategy development tool.
Conclusion
I hope you've enjoyed this Sneak Peek of Chart Logic! It's coming along really quickly, and I am still anticipating a release for early next year. The big piece left to write is the trade operations (Conditions and Actions), but all of the core infrastructure is done. And then I want to do some pretty rigorous testing, as well as developing and testing a number of strategies to share as a starting point.
What do you guys think of this tool? Other than the trade operations which are still TBD, is there anything important that I'm missing that needs to be added? What would you do if you could script actions in MT4 with this degree of simplicity and flexibility? I mean, you can do this now by writing your own EAs and scripts, but we're not all programmers!
One of the most satisfying parts of developing and releasing MultiMAX was seeing how other people used Max in ways that I never even imagined, to create trading strategies that are far more profitable than the standard strategy files I provide on the website. I can't wait to see what people will be able to do with a tool like Chart Logic! Basically any strategy logic that you can describe within the framework of this logic can be implemented with this approach.
Hi d'Armond.
You have been very busy.
I I suspect you have enjoyed every minute in developing such a major project.
I had always thought that you were going to stretch the limits on using the basic MT4 program a little bit and that is exactly what you have managed to do with this latest concept.
Excellent work and it reminds me of some time back when I picked up a book by the author for the FORTH programming language, I was hooked.
I got a feeling that this is about to happen once again 😀
Regards,
Howard