
Here are some suggestions about how to effectively use Chart Logic in the MT4 strategy tester.
Preparation
First, you need to have a CL strategy to test, and it needs to be saved in the correct file location for CL. If you’ve saved it from CL then it’s in the right place, but if you’re downloading from somewhere (like the Files section of the Chart Logic website) then you need to copy the file to a place where CL can find it.
Common\Files\ChartLogicIn the CL inputs there’s a field where you can identify the strategy file to test:

The value for this field needs to be set to the file name you’re testing, including the “ChartLogic” directory, like this:

When run in the tester, CL will load this file and activate it for the current symbol only.
Model
In the MT4 strategy tester you have a choice between “Every Tick” or “Open Prices Only” in how it processes data (or Control Points, but I never use that one). Every tick is more accurate, but will be MUCH slower, as all the EA logic is called for every single piece of data. Open prices is much faster, but whether it gives you a reasonable picture of how the EA behaves depends very much on the EA logic. For Chart Logic, the question is what Cycle have you set for the various conditions in the strategy. If every Cycle is set to “Bar”, then they will only ever perform their tests on a new bar, and you can get excellent results by selecting “Open Prices Only.” On the other hand if any conditions have their Cycle set to “Tick” then you will need to run the tester with the “Every Tick” model to get accurate results.
For example, with the Casper Silver Bullet strategy, most conditions are set to Bar, but the conditions to test for entries are set to Tick. Any time price reaches the entry price we immediately enter, not waiting for a new candle. So if you want to get a more accurate picture of how this behaves you’d need to select the “Every Tick” model.
CL Strategy Viewer
When you’re running CL on a normal chart you get the main CL window, where you can load, edit and activate strategies. When you run CL in the strategy viewer, you do not get this window. You’re not editing or activating strategies here, you’re just running one. Instead it will automatically display the Strategy Viewer window for your strategy. For instance, with the Casper Silver Bullet strategy:

You can expand/collapse different sections using the arrows to the left of the rows. You can toggle the expand/collapse of ALL sections at once by clicking the “Exp” column header (the header of the 1st column). This will quickly expand/collapse everything.
For clicking buttons in the Strategy Viewer window in the MT4 strategy tester, be aware that the window can only process these mouse clicks when the strategy is running. If you have the tester paused and you click a button, nothing will happen until you advance at least one tick forward.
Also, if you don’t want to monitor any data and just want to see the chart, click the minimize button in the top-right corder of the Strategy Viewer’s title bar to minimize the whole window.
As an added convenience, you can pre-configure how you want this window to display before starting the strategy tester. On your chart where you are editing the CL file, open up the strategy viewer (click the strategy name in the main window). Make sure the strategy is not active first because we want to modify the strategy, not a running thread. Then, configure the display of rows the way you want to see them in the strategy viewer. When you have it looking the way you want (the specific sections expanded/collapsed that you want) then close the viewer and save the strategy back to the file. It saves the expand/collapse state as part of the strategy file. When you run this in the strategy tester it will automatically be displayed the way you have configured it.
Monitoring CL data
Let’s look at a strategy that is running:
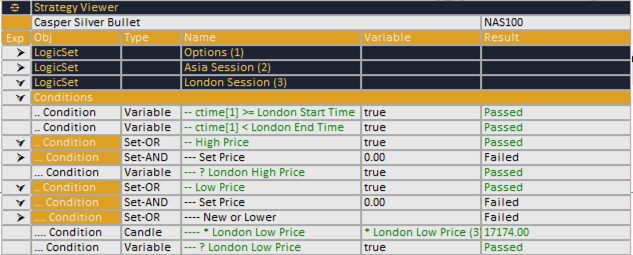
For each row, if it’s shown in green that means that the condition evaluated as true the last time it was evaluated. If the condition is returning a value (like the Candle Condition shown above, 2nd row from the bottom) then the value being returned will be displayed in the “Result” column. Otherwise it will just say “passed” or “failed.”
When you’re running CL on a normal chart you can click the name of any condition or action in this view, and CL will open a read-only dialog to display the details of that condition or action. This does NOT work in the strategy tester, because the tester does not support some UI behaviors needed for this display.
For most conditions that are performing some calculation or operation, if you hover over the text in the “Result” column it will give you more detailed information about the test that was performed. For instance:

This can be useful to get more precise feedback about why something passed or failed. With the Variable Condition there is also a number included in the hover text when you’re performing a calculation. This number is a reference to the section of the code that performed the calculation, and is only useful to me as the developer to understand what part of the code was processing this data. If you are having problems with CL and need to reach out to me for help, if you include this number that will be of great help to me in better understanding the problem you’re having.
Passed/Failed
Keep in mind how CL processes data. In a Logic Set, we evaluate each Condition in order, and it can either be evaluated as true or false. If it is true then processing continues to the next Condition; otherwise processing stops there. So consider this case: a condition passes, and the next condition runs and processes its data, passes and stores some record of its data. Then on the next tick the first condition fails, and processing stops there. In the Strategy Viewer we see this as a higher-up condition failing, and the condition below it passing. That’s because the lower condition doesn’t know that the condition before it failed; all it knows is that the last time it was run, it passed. Sometimes when we’re looking at data in the viewer it can be confusing to see that something passed with some value, but some effect we were expecting did not occur because on this tick processing never got back to this condition.
Debugging
When I’m really stuck understanding why a CL strategy is not working right, it can be helpful to turn on debugging and trace through, one tick at a time, in the strategy tester to examine exactly what CL is doing. In the EA’s inputs, go to the bottom of the inputs and set the logging level:

Normally you’d keep this at INFO or higher to reduce the burden on the logs (you should routinely delete your old log files btw). But when you’re having trouble, the debugging info can be incredibly useful. With debugging turned on, get the Strategy Viewer window to display the data you’re interested in and pause the tester. Switch to the “Journal” tab in the tester’s window, and step forward one tick/bar at a time by using the keyboard shortcut F12. Then watch the debugging data written to the Journal for that action. There is a ton of data and not all of it will make sense, but you’ll get a good picture of everything that’s happening. If you’re having some trouble with CL or a strategy and you reach out to me for help, this is the kind of information I may ask for to help understand what’s going on.

When you’re done, be sure to return the logging level to something less taxing.
Actions
The data displayed in the Actions section is a little different:

The “Variable” column is showing the input field for the Action, and the “Result” column is showing the value for that field. There are of course many input fields for each Action type and we’re only showing one here. Click the “*” on the left side of the row to toggle through all of the fields for this action and display their values. For instance, for the trendline object action we might want to see what the value of one of the price fields is:

For actions that are setting fields from variables, this can be really useful to see what the last value that was passed to the action was. The Variable column shows you both the field name and the variable name it was set to, and the Result column is showing the value. Hover over any of these cells if the column width is too small to see all of the text in the cell.
Final Considerations
It can be incredibly powerful to run your CL strategy in the strategy tester to see how it performs over time. Personally I use this to make sure things are behaving correctly, and much less as a means to assess if a strategy is going to be profitable. There are just too many differences between backtesting and running a strategy live to give too much weight to backtest results. It can be interesting of course, and we do like to see our strategies give us profitable results in the tester, but give it the appropriate level of skepticism. The only real results that matter are live, forward results.
There is one huge shortcoming to using CL in the strategy tester, and that is that you cannot optimize parameters to your EA. All of the options that you use in your CL strategy are defined in the strategy itself, not as part of the EA inputs. I am considering ways around this, but it has been a lower priority. If there is sufficient interest in addressing this then I will reconsider how to do this, but for now this is a known limitation.